Comparative genomic hybridization (CGH)
Comparative genomic hybridization (CGH)
CGH can be used to demonstrate gains and losses of DNA through the entire genome of a tumor sample. While initially a research tool, its application has led to important discoveries that have been translated into focused genetic tests. In other cases, more global information is needed and this test is increasingly applied in the clinical setting, such as distinguishing melanoma from melanocytic mimics.13
addition, a reference probe of normal genomic DNA from a healthy donor is labeled with a different fluorochrome (red, for example). Equal amounts of the green- and red-labeled DNA are mixed and hybridized onto a substrate, which represents the entire human genome. Originally, these were metaphase spreads of normal human chromosomes prepared from lymphocytes of a healthy donor that represented a cytogenetic map. More recently, this substrate has been replaced by manufactured microarrays composed of nucleotide probes that are printed at high density on a solid surface.15 Depending on the number and lengths of these nucleotide probes, the entire genome can be represented on an array. By using smaller probes, higher resolution of genetic gains and losses can be achieved. During the hybridization, the red- and green-labeled DNA populations compete for binding to corresponding regional microarray targets. For each array target (or region of a chromosome in the original protocol) the ratio of red and green fluorescence intensity ratio is determined. A ratio of 1 indicates a balanced situation at this locus, i.e., no gain or loss in the tumor (see Fig. 2.28). In the presence of deletions in the tumor genome, less green probe will be available to hybridize to the corresponding targets, which will result in a decreased green to red fluorescence intensity ratio (< 1). In the presence of increased copies, the corresponding targets still show a green to red fluorescence intensity ratio greater than 1. The ratio of red and green fluorescence intensity can be used to quantify the copy number change. A ratio of 1 indicates normal copy number, a ratio < 1 indicates a loss, and a ratio > 1 indicates
CGH demonstrates for the entire genome:
• regions of chromosomal loss (often containing tumor suppressor genes),
• regions of chromosomal gains (often containing oncogenes),
• overall patterns of gains and losses (rather than just a few focused regions). As originally described, CGH detects and maps DNA sequence copy number variation throughout the entire genome onto a cytogenetic map supplied by metaphase chromosomes (Fig. 2.27).14 CGH can be regarded as a variation of FISH in which the entire genome of a sample such as DNA from a skin tumor is used as a hybridization probe. The tumor is freed as much as practically feasible from contaminating normal cells by manual dissection, the DNA extracted, and labeled with a fluorochrome (green, for example). In
48 Specialized techniques in dermatopathology
The full experimental protocol for CGH is slightly more complex than outlined above. A third, unlabeled DNA population is needed to ascertain that repetitive regions that are scattered throughout the genome do not cross-hybridize and interfere with the measurement. This blocking DNA is highly enriched for repetitive regions and suppresses unwanted cross-hybridization between repetitive regions in the labeled DNA populations and the chromosomes which serve as substrate. CGH has revolutionized the cytogenetic analysis of solid tumors. Compared to conventional cytogenetic analysis, CGH does not require culture of cells for karyotypic analysis, which brings the major advantage that CGH can be performed on archival tissue. It is important to note that the DNA copy number measurement obtained with CGH represents an average of the entire cell population from which the DNA was extracted. For this reason, only the copy number alterations present in a substantial portion of the cells are detected by the method. Depending on the type and amplitude of aberration – amplifications can be detected most easily – the copy number change needs to be present in about 30% to 50% of the cells in order to be identifiable. Alterations affecting only a minority of cells remain undetected. A further limitation is that CGH only detects genomic aberrations that result in DNA copy number changes. Balanced translocations and point mutations are not detected. Copy number neutral rearrangements that arise through chromosomal recombination and LOH (see above) are also not detectable by CGH. More recent implementations that use oligonucleotides to determine single nucleotide polymorphisms (SNPs) allow the genome-wide simultaneous assessment of DNA copy number and LOH in unfixed tumor tissue.16,17 Due to lack of sensitivity, these methods are not routinely used for clinical diagnosis.
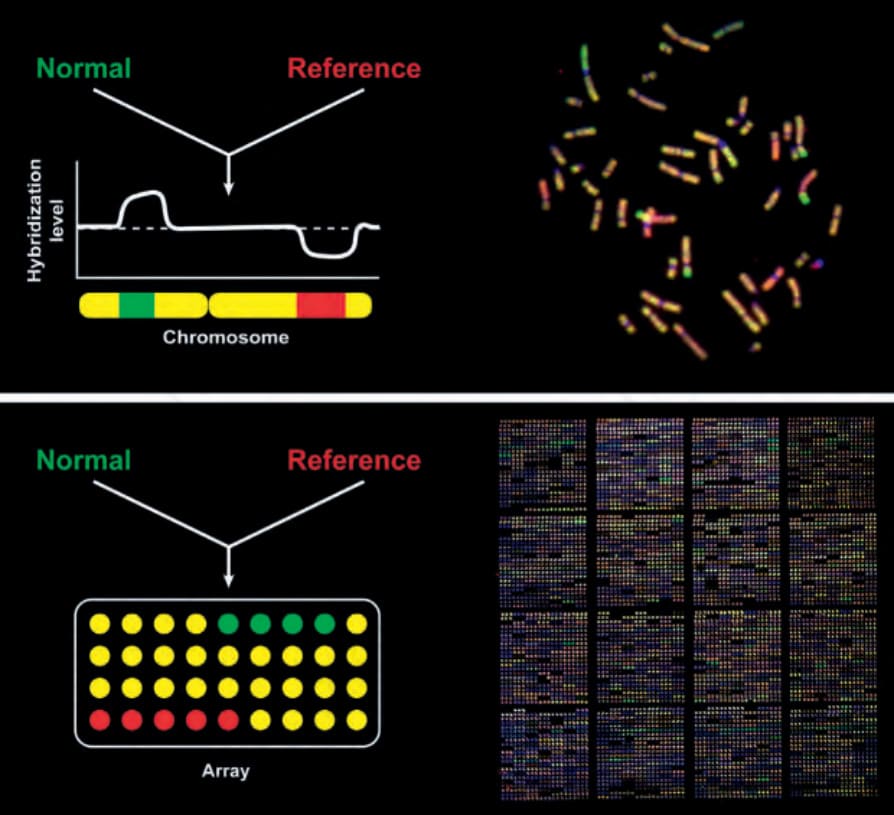
Fig. 2.27 Comparative genomic hybridization (CGH) on a metaphase chromosome spread (upper panels) and a microarray (lower panels): the regions of the chromosomes (upper panel) that appear red are affected by deletions, whereas the regions that appear green are affected by gains or amplifications (bright green). Yellow indicates an area with normal DNA complement–no gain or loss. The lower panel on the right shows a DNA microarray with approximately 2500 targets printed as triplicates spots. Triplets that appear green indicate gains whereas those that appear red indicate loss. The array targets are not printed in order of their genomic position which can help control for technical variations. The precise genomic location of the DNA copy number changes detected by the measurement only becomes apparent after plotting the average ratios of red to green fluorescence intensities corresponding to their genomic position as illustrated in Fig. 2.28.
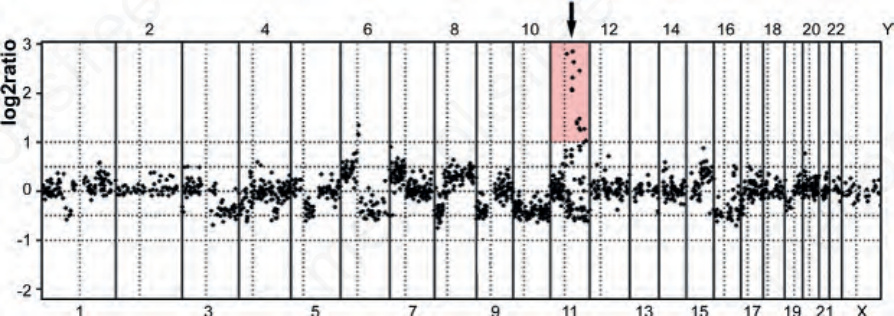
Fig. 2.28 DNA copy number changes as detected by array comparative genomic hybridization of an acral melanoma: the graph shows the log2 of the ratio of the fluorescence intensity ratios of tumor to reference DNA plotted according to their genomic position on the x-axis. The numbers at the top and at the bottom indicate the chromosomes. A log2 ratio of zero corresponds to normal copy number. As can be seen, multiple contiguous chromosomal regions showed losses and gains. The arrow corresponds to an amplification of chromosome 11q13 interval containing the gene that encodes cyclin D1.